The Feltron Reports: Days in the Life of an “Infographic Storyteller”

While perusing  feltron.com, I came across a link to Nicholas Felton’s blog on tumblr.  Thinking it would be interesting to see what he blogs about as I prepared to write my own post, I scrolled through the most recent stories. Interestingly, the last post was from about a month ago; I’d assumed that Felton would be a frequent blogger. I was also somewhat surprised by all of the photographs this man of numbers had posted (though I probably shouldn’t have been because I’d read his Feltron Reports and seen the incredible number of pictures–digital and analog–that he’s taken over the course of a few years).  In the midst of some photographs and re-blogged articles, I saw a video of Felton speaking at the 2012 Eyeo Festival. While I didn’t watch his whole presentation, I did watch a few minutes of “A Man of Few Words* (*But Many Numbers)”.

Felton breaks down the creation of his yearly reports into eight steps in this video, focusing on his most recent work– the 2010 – 2011 Biennial Report (which interestingly focuses on relationships, perhaps after the death of his father in 2010 caused him to pause his work on the project and turn it into a two-year piece). To preface the in-depth description of his methodology, he describes why numbers, “the new elemental material”, are so fascinating: they have “infinite potential”, are “malleable” (they can be moved and associated with other data without changing their intrinsic meaning), and can help one to tell his own life story. Even this brief background gave me a better understanding of why Felton would want to encapsulate his life in numbers–the young graphic designer once struggling to find material used them to transform himself into an “infographic storyteller”.

I ended up looking through all of the Feltron Reports–they’re really interesting, not too long, and very visually appealing. It was interesting to see how Felton’s style evolved over the course of half a decade; the first report, from 2005, contains data supplemented with many photographs, and its design is straightforward and simple. By 2006, he had changed his focus completely, using graphics that were much more complex and a format that was utilized lots of colors, shapes, and numbers. By 2007 – 2008, he was using a variety of graphically reproduced maps, as well. It was also neat to see how the subject matter of each report changed; while in 2007 he focused on collecting data about the many facets of his daily life (music, eating, reading, travel, etc.), his 2009 Report focused on the relationships/encounters he’d had with people (what they’d done, what mood he was in, what they’d talked about), and his 2010 Report (“The Paternal Report”) reflected on his father’s life.

While I really enjoy the design aspect of the Reports, I’m fascinated by the ways in which Felton collects his data–I can’t imagine trying to keep track of all of those statistics for an entire year! The 2010 Report, a legacy to his father, featured material already in his possession, but the 2009 Report (about his relationships) featured data collected from online surveys filled out by everyone with whom Felton had had “meaningful encounters” (if they remembered/chose to respond). Felton is the co-creator of a website that shows people how to collect data of the sort that fills the rest of his reports– daytum.com. I’m impressed by the discipline it would take to remember to track some of the relatively mundane details/data of day-to-day life, though I guess for someone like Felton, it’s become a habit (and maybe even a bit of an obsession). With his novel way of looking at the world, it’s no wonder the Fast Company named Felton one of the 50 most influential designers in America.

 

Google Earth

I had so much fun using Google Earth! It’s an awesome app; I loved being able to “fly” around the world and to zoom in so far that individual houses could be seen (just as they can be when using the satellite feature on Google Maps). I did some “traveling” to my must-see locations, and then returned to my town in Pennsylvania, zooming in far enough to see my own house. It’s pretty neat.

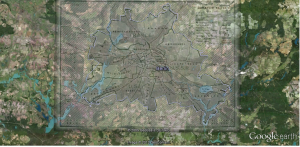
I chose to create a map of Berlin because I’ll be traveling there over winter break; I overlayed a map from the United Kingdom’s National Archives Education Division in its coverage of the Berlin Blockade/Cold War.

Occupied Berlin, 1948 - 1949

The overlay map shows the divisions of Berlin by France, the United Kingdom, the United States, and the Soviet Union after World War II, with this particular map referring specifically to the Berlin Blockade of 1948 – 1949. Berlin’s overall boundaries do not seem to have changed much from the mid-20th Century (black lines) to the present (purple lines), though differences are noticeable in the southwest corner and borders have changed slightly in the northwest corner. Even though there were relatively few major adjustments made to boundaries, matching the historic and present cities’ borders was still a little bit of a challenge and could not be completely accomplished. The hardest part of the exercise was finding a map of Berlin that  I was able to use with the image overlay function; several would not show up–only a red ‘x’ would appear in their place. After finding this image, though, I was able to complete the exercise and became more comfortable with a variety of the layers on the Google Earth toolbar (for clarity’s sake, I didn’t use any of them in this first overlay).

“The Differences Slavery Made: An Analysis [of Digital Scolarship]”

Thomas and Ayers, both of the University of Virginia, offer their work, “The Differences Slavery Made: A Close Analysis of Two Historical Communities“, as a model of building digital scholarship from “the ground up”. Their extensive research, which chronicles and catalogs the political, social,agricultural, industrial, and economic circumstances of a Union town and Confederate town within the same geographic region, presents an excellent case study about the influence of slavery in shaping society.

The authors “attempt to translate the fundamental components of professional scholarship-evidence, engagement with prior scholarship, and a scholarly argument-into forms that take advantage of the possibilities of electronic media.” Their study does so by incorporating four particular qualities. It is:

  1. spatial
  2. participatory
  3. procedural
  4. encyclopedic

I felt as though the authors did construct the site in a way that lent itself to exhibiting these characteristics. Its maps, graphs, and charts were certainly valuable evidence in the research process but could stand alone for separate study. The website engages the reader and makes him an active participant, rather than a passive viewer. Participation is crucial in engaging the “procedural” layout–with its many steps and components–which holds a great volume of material.

Despite its many promising features, the authors also note that their case study has presented areas for future digital historians to improve upon:

  • how to present narrative more effectively
  • how to represent event and change
  • how to analyze language more precisely
  • how to create visualizations as compelling and complete as narrative

I thought the site was impressive, but I think some of these areas need to be addressed, as well. The flow of the narrative seemed somewhat apparent at first–one should just follow the links/tabs in order on the left–but became harder to determine because of the volume of information. Perhaps the tabs above the text are meant to be read first to provide context (“Overview”, “Presentation”, “About the Author”, “Acknowledgements”).  Additional tabs toward the top and bottom of the page–“Evidence”, “Historiography”, and “Tools”– may cause some confusion if the reader is uncertain as to where to start (these are probably not the best choice, because reading the “Summary of Argument” articles first provides context for appreciating these topics later).  It becomes relatively clear that the site is not necessarily configured in any particular order, but rather grouped by concepts–arguments, methodology, points of analysis, etc.–that the reader may browse in the order he chooses. There is not one “best” way to go about perusing the site. While I understand the philosophy of allowing the reader to follow the “procedural” guidelines, which involve sifting through multiple layers, I think the page set-up could be a little more streamlined (as well as more visually engaging–the home page does not draw the reader in).

In terms of other visual questions, the maps and charts available on the site are excellent, but if one does not take the time to ” follow [the] procedures to follow the intricacy below the level of the analysis”, he may miss out on some compelling evidence. Because of this possibility, I think it might be wise to have thumbnail sketches of one or two maps on the introductory page in order to attract the reader’s attention.

With those suggestions in mind, I do think the authors did a great job of making the website “encyclopedic”–it offers a great deal more evidence and documentation than a fixed text could. In addition to a number of maps created using GIS technology, the website also contains full citations, synopses, and excerpts from each of the articles it quotes or references, and when possible, links to full-text versions of those articles. Neither of these practices would be possible when publishing in a standard journal. The website also offers an impressive set of tools–a reader can perform a full-text search, use the “Reading Record” to see which parts of the text he has viewed and which he hasn’t, and enter the citation “key” of a particular piece to be transported there directly.

While there is always room for improvement, I think Thomas and Ayers have created an excellent resource that demonstrates how beneficial technology can be in relaying complex historical data. In so doing, I think they largely achieved their goal: “In fashioning this digital presentation, in putting together components of argument, evidence, and historiography in sequences that are both modular and connected, we hope to have created a useful interpretive model [and have offered it] to the scholarly community as a first step in hopes that we might begin envisioning new forms of scholarship.”


Google Tools

Image

I really enjoyed trying out the Google charts and maps apps.

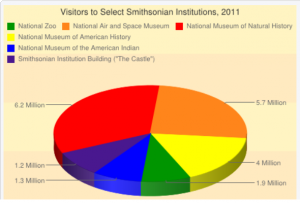
I created the pie chart below using information from the Smithsonian Newsdesk’s “Visitor Statistics” page. The chart app was a little difficult to use at some points; it didn’t allow me to enter some data sets right away, and it kept changing the colors that I had selected. One big caveat: I thought I understood how to embed the chart in my blog (using the HTML format), but despite my best efforts, I wasn’t able to get it to work. (I apologize if the quality of my chart isn’t great–I had to use a screen shot instead).

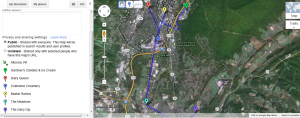
The interactive tutorial made using Google Maps easier than the chart app, but I still struggled with drawing clean lines (and again, with embedding the map–I’m sorry for the screen shot). I mapped a few of my favorite ice cream places in my hometown (Altoona, PA). I’m excited to become more familiar with both of these tools!