Scratch That: My First Programming Attempts

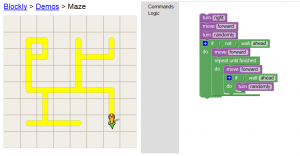
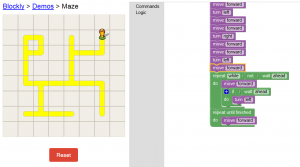
I had fun finishing the Blockly maze; for my first attempt, I just completed it using basic commands, so it was relatively simple.

Next, I clicked on “Randomize Maze” and was given a different puzzle. I decided to challenge myself a little bit more than I had on the first attempt, so I told the character to turn “randomly”. The sequence I eventually came up with allowed him to solve it every time (although some of his tries took much longer than others!)

(*One caveat: sometimes, at the second block, where I have the instruction to turn randomly, the character would not move if he turned right first, and I had to hit reset. I imagine this is a flaw in my programming, but I can’t figure it out because it didn’t always happen.)

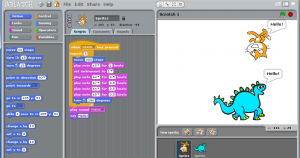
Due to a small confidence boost after my randomly-turning character got through the Blockly maze a few times, I felt prepared to move on to Scratch. My first program was very basic; I had the given cat Sprite move back and forth across the screen while an arpeggio played (C-E-G-E-C). After 5 repetitions, he stopped, meowed, and said “hello”. I then added a second Sprite, a (super cute) dinosaur, and had him walk across the screen to meet the cat, this time in step with three notes played on the xylophone. He then returned the cat’s greeting with his own “hello”. I think Scratch is very user-friendly, but I found creating even this extremely simple sample to be difficult at times.

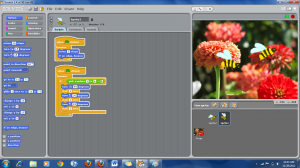
I wanted to try to create something a little more complex, so I looked at the project examples under the File tab; I focused on animations and games. I ended up choosing a sample background (flowers) and imported two Sprites (bees). I tried to follow the example from the aquarium animation as best I could (I wanted my bees to move around like the fish had), though I didn’t understand a few of the components (i.e.–“pick random 1 – 6 = 1”). I ended up adjusting the speeds, degrees, and timing of the movements of the bees, but the aquarium example provided a helpful and much-needed guide.  I also tried to incorporate sound–I recorded the vibration of my phone when it receives a text message, which I thought might make a believable “buzzing” sound. When I inserted the recording into the program, though, it was inaudible; there was just a lot of white noise. Another issue arose when I discovered that my bees occasionally fly upside down; I’m not entirely opposed to that, but I don’t think it’s exactly realistic.

I really enjoyed using Scratch, but I found even this basic introduction to programming to be pretty challenging. I think its creators at MIT were brilliant in designing it the way they did, with puzzle pieces, simple commands, and color-coded categories–it’s so much more accessible than code, and created for a much broader audience. I’m looking forward to working with it more and hopefully creating a dynamic piece of animation!

 

It’s Time for Programming Already?! : An Intro to Scratch

It’s hard to believe that it’s already time for programming–this semester has gone so quickly. Over Thanksgiving, I was talking with my brother, who is a senior studying mechanical engineering at Carnegie Mellon, about this class and about the programming we’d be doing this week. I told him that I thought that the program was called Scratch; he said he wasn’t familiar with it. After watching the video and reading the start-up guide, I understand why; it looks as though the program will be great for someone like me with absolutely no programming experience, but not as practical for someone like my brother who is well-versed in several programming languages.

I’m looking forward to working with Scratch because it seems to be designed for anyone; the basic format is easy-to-use, and the steps used to create movements or sequences of events are clear and simple. Scratch is a great introduction to programming; it illuminates the basic principles while being user-friendly to those of us who are less tech-savvy. I had been expecting to be working with a programming language similar to something my brother uses in his work–I’m glad to know other options exist!

I was a little bit surprised by Scratch’s somewhat dated graphics (though its capabilities are impressive). I guess this makes sense in the context of its being developed by MIT’s Lifelong Kindergarten research group, which “develops technologies that, in the spirit of the blocks and fingerpaint of kindergarten, expand the range of what people can design, create, and learn”. The graphics are simple, yet effective.

Scratch reminded me of Alice, the programming software designed by the late Randy Pausch and his team at Carnegie Mellon University. It uses similar simple graphics to help people learn how to program, but its storytelling capabilities are geared toward younger girls so as to interest them in a field in which their gender is underrepresented (much like the newer Goldie Blocks Engineering Toy for Girls; both seek to entertain the curiosity of younger girls and potentially inspire them to study CS or engineering).

I’m sure Scratch has the same potential–not just to interest girls, but to inspire the next generation of computer programmers. While it’s not very likely that I’ll be one of them, I’m really looking forward to working with it this week (and maybe beyond!)


Preservation Path

It’s a little overwhelming to think about the amount of digital media that I possess/have generated but haven’t taken steps to preserve. This class has been a great learning experience in so many ways, and digital preservation is one of the key concepts it’s taught me to appreciate. I’ve often wondered what technology will be like in the future, having already seen it evolve such a great deal in my own lifetime–from cassettes, VHS tapes, and Macintosh computers to CDs/MP3, DVDs, and ipads. I don’t often think anymore about the old VHS tapes I used to watch; if I don’t decide to buy them on DVD, I imagine they will have become largely archaic in just a few more years. A small part of my childhood will vanish, will be forgotten. How have I not considered what will happen to the pictures, documents, websites, and other digital media that I use now?

Maybe one reason I’ve been nonchalant about preserving my digital media is simply ignorance. I hadn’t really stopped to consider the fact that the formats I use now have the potential to become obsolete at any time; they’re not going to last forever, just like my VHS tapes. While I’ve been intending to back up my picture files (which I made note of in an earlier blog post but regrettably have yet to do), I hadn’t really thought about how to save e-mails and music files.

The Library of Congress devotes a portion of its website to describing the steps one can take to preserve digital media; it’s a great resource. The “Personal Archiving: Preserving Your Digital Memories” page provides an excellent summary of techniques for saving digital pictures, audio, video, and documents. It’s something I’m going to share with my family (especially my brother, because he helps my parents with a lot of their computer issues) and some of my friends. As identified by the Library of Congress, my family can begin taking some practical steps to preserve our memories, and hopefully it will become a life-long habit:

  1. identify what we want to save
  2. decide what is most important to us
  3. organize the content (i.e.–into a file called “Our Archive” with sub-folders)
  4. save copies in different formats (i.e.–a hard drive, in print, and online), and move at least one copy to a different physical location
  5. manage our archive (move contents to a new drive at least every 5 years)

These steps are useful for virtually all types of digital media, especially the four that my family uses most often*:

Photographs

  1. identify pictures on cameras, memory cards, computers, and online
  2. save the photography of highest quality if there are multiple copies of an image
  3. label each photograph to be saved and put it in the appropriate Archive sub-folder; describe the photos and folders
  4. save copies in different formats (i.e.–a hard drive, in print, and/or online)
  5. check to make sure photographs are readable at least once a year

Audio

  1. identify audio files on phones, computers, memory cards, DVDs, CDs, and those on audio software; make sure they are in an open file format
  2. pick the most important recordings and save the one of highest quality if there are multiple copies of a recording
  3. export the files (using the “save as” command or by automatically exporting them); save them in an open file format; save metadata for each recording, including the date it was exported; label/describe each recording and put it in the appropriate Archive sub-folder
  4. save copies in different formats (i.e.–a hard drive, in print, and/or online)
  5. check to make sure recordings are readable at least once a year

Personal Documents

  1. identify documents on computers, flash drives, CDs, floppy disks, and online
  2. determine whether to save drafts of important documents with the final copies
  3. label each document and put it in the appropriate Archive sub-folder; describe the documents and folders
  4. save copies in different formats (i.e.–a hard drive, in print, and/or online)
  5. check to make sure documents are readable at least once a year

E-mail

  1. identify all e-mail accounts and folders within those accounts, including “archived” messages
  2. save attachments that are part of selected messages
  3. export the messages (using the “save as” command or by automatically exporting them); save them in an open file format; save metadata for each message, including the message “header”/subject and the date it was exported; label/describe each message and put it in the appropriate Archive sub-folder
  4. save copies in different formats (i.e.–a hard drive, in print, and/or online)
  5. check to make sure messages are readable at least once a year

(*I should also investigate the Library of Congress’ suggestions for preserving websites, like this blog and my Facebook page).

One of the things that really struck me was the sheer volume of digital media that I alone possess; my family’s total record would be massive. While preserving digital media provides many new challenges, the basic principle behind it is the same as that utilized by archivists pouring through 2-D documents and photographs (and a concept practiced by all of us in our everyday lives): you just can’t keep everything. While you may never know what might be of importance to future generations, you have to make decisions as to what you think will be the most relevant (and/or what you’d most like to be remembered), and trust that they will piece the rest together. If we are willing to put in the time and effort it will take to preserve our digital pasts, we’ll be much more likely to access and enjoy the memories for years to come.


A Paradigm Shift: Historical Abundance in a Digital World

As the semester draws to a close, Roy Rosenzweig’s extensive article, “Scarcity or Abundance? Preserving the Past in a Digital Era“, brings us almost full circle to the first few weeks of class, when we discussed the positives, perils, and new frontiers created by the digital world in which we live.

One of Rosenzweig’s main points involves constructively criticizing historians’ lack of involvement in debates and proposals for new methods of preserving digital material. He then provides reasons as to why their involvement has been limited and why the need for their input to increase is so gravely important.

Rosenzweig notes that historians are prone to relegating questions about digital preservation to archivists and computer scientists, but that

While these technical difficulties are immense, the social, economic, legal, and organizational problems are worse. Digital documents–precisely because they are in a new medium–have disrupted long-evolved systems of trust and authenticity, ownership, and preservation. Reestablishing those systems or inventing new ones is more difficult than coming up with a long-lived storage mechanism.

While I am not sure that I agree that these concepts are more difficult than discovering a solution to digital preservation problems, I think they are also of pressing importance–the blurred lines of copyright provide a pertinent example, as well as questions about determining the legitimacy of digital documents.  Not only are these issues relevant; the prevalence of digitized historical media is causing historians to re-evaluate their practice of the discipline. Who is the new, expanded audience? Should the nature of historical journals–and the types of articles included in them–change? Perhaps most importantly: “Will abundance bring better or more thoughtful history?” Rosenzweig continues:

Surely, the injunction of traditional historians to look at “everything” cannot survive in a digital era in which “everything” has survived. The historical narratives that future historians write may not actually look much different from those that are crafted today, but the methodologies they use may need to change radically. Historians have time to think about changing their methods to meet the challenge of a cornucopia of historical sources. But they need to act more immediately on preserving the digital present or that reconsideration will be moot; they will be struggling with a scarcity, not an overabundance, of sources.

This scarcity might stem from a variety of issues, as Rosenzweig posits: corruption of digital material, the inability to recover obsolete digital material, confusion over what should be preserved (i.e.–which e-mails should be saved?), and the quest to find the perfect, all-encompassing preservation system instead of focusing efforts in the present. He notes, “We have never preserved everything; we need to start preserving something.”

While historians may not be particularly involved in the technical aspects of the creation of preservation systems, Rosenzweig believes that they have the responsibility to make sure those projects continue. Though seeking the intervention of the national government is not always enough, as many of these questions transcend national boundaries,”advocates of digital preservation” should still try

…To mobilize state funding and state power (such as the assertion of eminent domain over copyright materials) but infuse it with the experimental and ad hoc spirit of the Internet Archive. They should also argue forcefully for the democratized access to the historical record that digital media make possible. And they must add their voices to those calling for expanding copyright deposit–and opposing copyright extension, for that matter–of digital materials so as to remove some of the legal clouds hanging over efforts like the Internet Archive and to halt the ongoing privatization of historical resources. Even in the absence of state action, historians should take steps individually and within their professional organizations to embrace the culture of abundance made possible by digital media and expand the public space of scholarship–for example, making their own work available for free on the web, cross-referencing other digital scholarship, and perhaps depositing their sources online for other scholars to use. A vigorous public domain today is a prerequisite for a healthy historical record.

Rosenzweig noted in this 2003 article that not enough had been written by historians about this topic; nine years later, the need for history students such as ourselves to address these issues is more pressing than ever. Today’s digital landscape has certainly influenced the way we practice and study history–it will be up to our generation to protect the past and preserve the present for the future.


Google Ngram Viewer

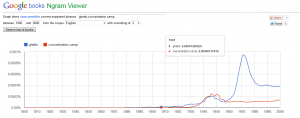
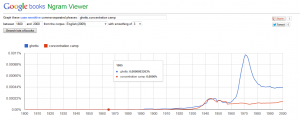
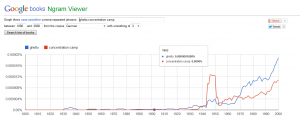
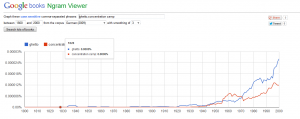
I enjoyed doing some random word searches with Google Ngram over the weekend; for today’s post, I decided to focus on two terms related to the research I’ve been doing for another history class about the Holocaust. I chose “ghetto” and “concentration camp” and performed this search using four corpora: English, English (2009), German, and German (2009). I also tried to perform the search in Hebrew, but it yielded no results, which I thought was very curious.

As Joyce mentioned in her post, seeing trends in word usage as presented by Ngram is neat, but it doesn’t provide the opportunity to completely evaluate such trends because the books from which the data is drawn are not listed and other sources–like periodicals and journals–are not incorporated.  A little confusion also exists because of the discrepancies in search results between similar categories (for example, German and German (2009).) While both corpora span the same number of years, they yield strikingly different results that are not immediately explainable.  Despite these hesitations, Ngram Viewer seems a great tool for gaining general knowledge of word patterns as a basis for further research.

English:

The graphs resulting from searching “English” and “English (2009)” were very similar; both seemed to present the same general data: use of the term “ghetto” peaked during the mid-1970s, and the use of “concentration camp” spiked during the mid-1940s through the 1950s. These trends seem to be reasonable at face value, though they also call for further research. Concentration camps were liberated by the Allies in the mid-1940s, so it seems logical that a large number of volumes would be produced in the years following the end of the war, as soldiers recounted their stories and official government statements and photographs were released to the public. Perhaps the upswing in the usage of the term “ghetto” during the early 1970s can be explained by the fact that it took many Holocaust survivors decades to talk about their experiences, and that some of the earlier testimonies were not published in English for many years (both of these scenarios have played out in the research I have been doing about the Warsaw Ghetto Uprising).

English (2009):

German:

It is more difficult to explain the trends of the words’ usage in German, especially because the corpora yielded very different results. The German corpora showed the use of “concentration camp” peaking during the late-1940s and early-1950s with a resurgence in the late-1990s, while the German (2009) corpora showed a much smaller concentration of the word (the line was less steep) and peaked around the early- to mid-1960s (though it does also show a resurgence during the late-1990s). The German corpora shows the use of “ghetto” as increasing dramatically from the Holocaust to the present and peaking where the chart’s data ends, at the year 2000. The German (2009) information is similar, with its peak around the year 2000, but it has a less steep a slope than the original corpora. I’m not entirely sure how to interpret this data.

German (2009):

Data Mining

I really enjoyed testing the tools from this week’s exercise; when I first signed up to take this class, data mining exercises (though I didn’t know how they were conducted or how to perform them) were the first thing that came to mind when I thought of “digital history” (probably because I’d gone to a lecture given by Professor Cohen last spring in which he mentioned some of the ways new trends had been discovered through its use.)  I’d explored the TIME Corpus before (during our discussions about copyright), but hadn’t used anything of the other tools. Wordle‘s “word clouds” are really neat; I was able to browse the collection, but wasn’t able to create my own. While I think the word clouds are very visually appealing, they don’t provide nearly the amount of information that Bookworm, Google Ngram Viewer, or Voyant Tools do.

Bookworm allows a researcher to see trends in a word’s usage from 1815 – 1920. Searches through hundreds of thousands of books can be limited by subject, country, language, date, and gender; it’s a really impressive resource.  Google’s Ngram Viewer continues this service, showing word trends through the year 2000.  Voyant Tools takes a slightly different course, focusing on the individual words within a specific text (rather than a word’s usage within a given year). It shows trends of word usage within one document, splitting the text into sections and plotting the word patterns for each.  I had fun testing these tools by searching for a variety of words in the scientific and liberal arts categories in Bookworm and then repeating the search in Ngram; I also inserted in Voyant Tools some of my own text from a history paper I’m writing about the Holocaust.

Professor Cohen’s article, “From Babel to Knowledge: Data Mining Large Digital Collections“, provided good background about the tools necessary to create such programs–particularly keyword-in-context-indexing (KWIC) and application programming interfaces (APIs) like Google’s. While I think I’ll probably be using the programs developed through these processes (like those mentioned above) rather using them to create my own project, as Professor Cohen did with the Syllabus Finder, it’s really neat to see the awesome potential these tools have to reshape our views of history and historiography by helping us to discover new relationships and by redefining our approach to research in the present.


The Warsaw Ghetto Uprising

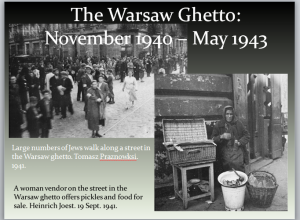
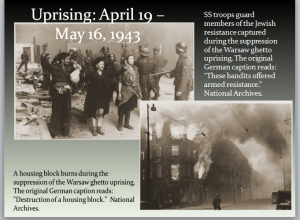
I chose to create slides about Jewish resistance to the Nazis in Poland’s Warsaw ghetto. I prepared a more comprehensive presentation for another history class in which I’m writing a paper about the topic, and it was difficult to decide which three slides to include. I enjoy using Prezi, but I thought it would probably be easiest to use PowerPoint since we were only creating a mini-presentation.  I prefer to keep my PowerPoint slides relatively simple, so the slides shown here contain only pictures and their captions (as provided by the Holocaust Museum).

Our discussion in class today got me interested in thinking about what other design choices I could have made; I think I could probably change my font to something that looks more like the typewriter-style font from the Vietnam War website we viewed, which has a certain military connotation and would reflect the creation of  clandestine newspapers and the Oneg Shabbat Archives I discuss in the full version of my presentation. Because my  actual presentation was being given to a class in a relatively large room, I made the captions bigger than I normally would so that they would be visible; otherwise, I definitely would prefer that they be smaller.

The Nazis invaded Poland on September 1, 1939.  Within a few days, they had reached its capital, Warsaw, and they began a fierce bombardment campaign. With its conclusion and their entry into the city, the Germans were quick to enact a series of anti-Jewish policies; employment restrictions and confiscation of property were commonplace.  Jews were routinely kidnapped to perform forced labor, and sporadic acts of violence were also committed against them. By November 1940, Jews had been forced to relocated to the city’s “Jewish quarter” following a typhus outbreak the previous year, during which the Nazis called the Jews “unclean” and set aside a special section of the city in which to consolidate them.  The ghetto was overcrowded (30% of Warsaw’s population had been forced into 2.4% of the city) and unsanitary, and disease was rampant.  Starvation was also prevalent, as Jews received a ration of 184 calories per day! These conditions forced Jews to resort to selling or trading any possessions they still had for food, or for participating in the illegal food-smuggling underground.

On July 22, 1942, German troops surrounded the ghetto. A proclamation was issued stating that a quota of Jews each day was to be “transported” or “relocated” to the East for work. In reality, these Jews were being sent to their deaths at Treblinka. About 254, 000 Jews, or 75% of the ghetto population, perished in this first wave of deportations.  Young children and the elderly were almost completely annihilated. The second deportation occurred in January of 1943, and though many Jews were able to hide and some small skirmishes broke out between Nazis and members of underground Jewish political groups, between 5000 – 6500 Jews were taken to Treblinka.

The final deportation, or liquidation, of the Warsaw ghetto began the day before Passover–April 19, 1943. Though the Nazis attempted to catch the Jews off-guard, two underground resistance groups–the ZOB and ZZW–were ready for them. Supplied with some weapons smuggled from the “Aryan” side of the city and armed with homemade Molotov cocktails and bombs, the Jewish resistance fighters confronted the Nazis in the streets and from the rooftops. Jewish civilians resisted passively, as well–many of them went into hiding underground, where they had constructed bunkers with electricity and running water. The Nazis’ three-day liquidation program turned into a battle that raged for 28 days. The Jews were out-manned and out-gunned, however, and on May 16, 1943, the Jewish synagogue was bombed and then the rest of the city was razed. Most of the Jews who were unable to escape to the “Aryan” side during the chaos perished.  Though a military victory for the Germans, the Warsaw Jews’ incredible bravery and refusal to submit to the Nazis served as inspiration for countless others repressed by the regime and the model for resistance in many other places.


PowerPoint: Is It Really ‘Evil’?

Edward Tufte and Peter Norvig both have a lot to say about Microsoft PowerPoint, and not much of it is positive.  Both authors, in their articles and satirical PowerPoint presentations, respectively, address some issues regarding the program which are certainly not unfounded. At the same time, both acknowledge briefly that PowerPoint has the potential to be a useful tool if only its features are exploited effectively.

I don’t at all disagree with Tufte and Norvig’s conclusions that PowerPoint is often over-used and abused. I’ve seen many a presentation where entirely too much information was crammed into a single slide, the presenter read directly from his slides, or the data/information provided did not really contribute anything to the presentation.  Still, I find Tufte’s analogy of the use of presentation software to a Stalin-like tactic in his article “PowerPoint is Evil” to be a bit much (though humorous); I’ve never felt that a presenter’s bullet points were personally assaulting me as he lorded his “dominance” or knowledge over me. Instead, I like the clarity and conciseness those points usually offer.

While I think Tufte’s point about the amount of time children spend working on a single PowerPoint in school is well-taken, I don’t think children are generally “being taught how to formulate client pitches and infomercials.” Instead, they’re usually fulfilling a part of their technology requirement, and likely within an interdisciplinary framework (i.e.–their subject matter must pertain to something they’ve covered in their Social Studies class). They’re practicing with the most widely-used presentation software, regardless of its potential flaws.

I agree with Tufte’s notion that charts can sometimes be made too complicated in PowerPoint, but the graphics in his article from 2003 are outdated; the chart types have become much more streamlined and user-friendly since then.  I think his claim that “Microsoft abandons any pretense of statistical integrity and reasoning [by] sell[ing] a product that messes up data with such systematic intensity”  can be disproved by many educational and corporate presentations; if an accurate data set is chosen, it can be represented faithfully within PowerPoint if the user manipulates it responsibly.

Norvig’s “Gettsburg PowerPoint Presentation” makes similar claims; it reduces Lincoln’s famous speech to a serious of bullet points and awful charts (in a pretty entertaining way). Norvig claims that PowerPoint “makes it harder to have an open exchange between presenter and audience, to convey ideas that do not neatly fit into outline format, or to have a truly inspiring presentation.” As he himself notes, though, the program was never intended to convey the eloquence of a speech like Lincoln’s, or any other great pieces of rhetoric. (Perhaps his greatest concern is that the use of PowerPoint might have a detrimental effect on the decision-making process; he refers to an investigation by Tufte about the use of PowerPoint at NASA during the time preceding the Columbia tragedy.)

Despite his strong objections, Tufte notes at the end of his piece that it is not so much PowerPoint itself that is evil, but rather, the way many people choose to use it.  As Tufte says, “The practical conclusions are clear.  PowerPoint is a competent slide manager and projector.  But rather than supplementing a presentation, it has become a substitute for it…[and it] routinely disrupts, dominates, and trivializes content.”  This point is the one with which I agree the most: PowerPoint should never be a substitute for debate, discussion, and the exchange of ideas, but instead, a means of enhancing one’s presentation to encourage those conversations. I think it would be good to take a cue from Norvig here: “Use visual aids [like PowerPoint] to convey visual information: photographs, charts, or diagrams. But do not use them to give the impression that the matter is solved, wrapped up in a few bullet points.”


Google Charts, Take Two

I had no trouble embedding my chart this time, which was exciting! Professor Cohen showed me that the hyperlink generated by the app is missing the “http:” when I create a chart, which I hadn’t realized the first time; knowing that this time around allowed me to insert it relatively easily. Creating the chart was easier than the first time, too, though there were still some features that I found a little hard to use (like getting the y-axis to contain the range of numbers I wanted; it had to be changed not only in the “Axes: Range” subheading, but also under the scales for each data set).

I chose to make a chart using information from Probing the Past, a collection of probate records from the mid-1700s to early 1800s from estates in Maryland and Virginia. At first it was hard to decide what information to compare; there’s a wealth of material available. I ended up browsing by time period and clicking on decades at random; then I’d skim several reports in a particular decade and move on to the next decade. I decided to try to compare two estates from the same period in the same town, but sometimes there were only two estates in the same area and their owners did not have items of comparable value. When I was browsing through the records from the 1770s, I decided to focus on those from 1776. At the dawn of our nation’s independence, there were many who were still not free; I decided to reflect this information in a chart dealing with the number of slaves owned by a given master.

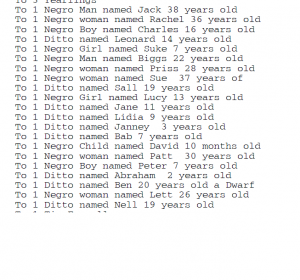
At first I thought I would compare the number of slaves held by  two different owners from the same area, but then I found that an interesting comparison could be made simply by looking at the records of one man. An inventory was taken of the possessions of John Fendall Beall of Prince Georges, MD on May 8, 1776, after his passing. On the third page, between listings of his cattle and his silver spoons, was this list:

Ages of John Fendall Beall's Male and Female Slaves, 1776

I would have liked to have included labels for each bar to denote specific ages; for example, the very first entry represents David, a ten-month-old baby, while the last female entry is for Sue, who is 37. I searched for a feature that might allow me to do so under every subheading without any luck. I hope the screenshot above will make the comparison relatively easy.

Seeing the data represented this way raises a number of questions. Of the twenty-one slaves belonging to Beall, 13 were female, and 12* were children (boys and girls) under 18–many of them were younger than 10. (*It is interesting to note that Ben, who is twenty years old, is also listed as a “boy” because he is a dwarf). What kind of land did Beall own? What kind(s) of work did his slaves do? If the vast majority of his workers were women and children, was his farm/plantation/factory as productive that of another owner of the same period who  had a greater number of adult male slaves? There are so many children; are they the offspring of his male and female slaves, or did he acquire them separately? Are any of the children Beall’s?

Relating information in a graphic format is very useful for historians; it almost immediately brings to light discrepancies, comparisons, and/or oddities that can provide a great starting point for research.